How to set up Filebeat and Logstash with Elasticsearch and Elastic Cloud?
We'll be discussing why and where do we need Filebeat and Logstash. Then We'll see how we can connect all the things in both self-hosted Elasticsearch and Elastic Cloud.


There are a lot of blogs and video tutorials on how to set up Filebeat and Logstash with self-hosted Elasticsearch. But when I tried to connect the same thing with Elastic Cloud, I faced too many problems. Because there was very little discussion about that in the community forums like StackOverflow or their own forums.
First, we'll be discussing why and where do we need Filebeat and Logstash. Then We'll see how we can connect all the things in both self-hosted Elasticsearch and Elastic Cloud.
- Why do we need both Filebeat and Logstash?
- How to install?
- Setting up self-hosted Elasticsearch
- Setting up Kibana
- Setting up Logstash (For both self-hosted and Elastic Cloud)
- Setting up Filebeat
Why do we need both Filebeat and Logstash?
When I was setting this up for the first time, I was very confused between these two. It felt like they both are doing the same things: They both can read from a file, convert JSON string logs to JSON, add extra fields if needed, etc. But after using both of them alone and together in several projects I got to know the differences and I started using both of them together only.
Let's understand this using the architecture:
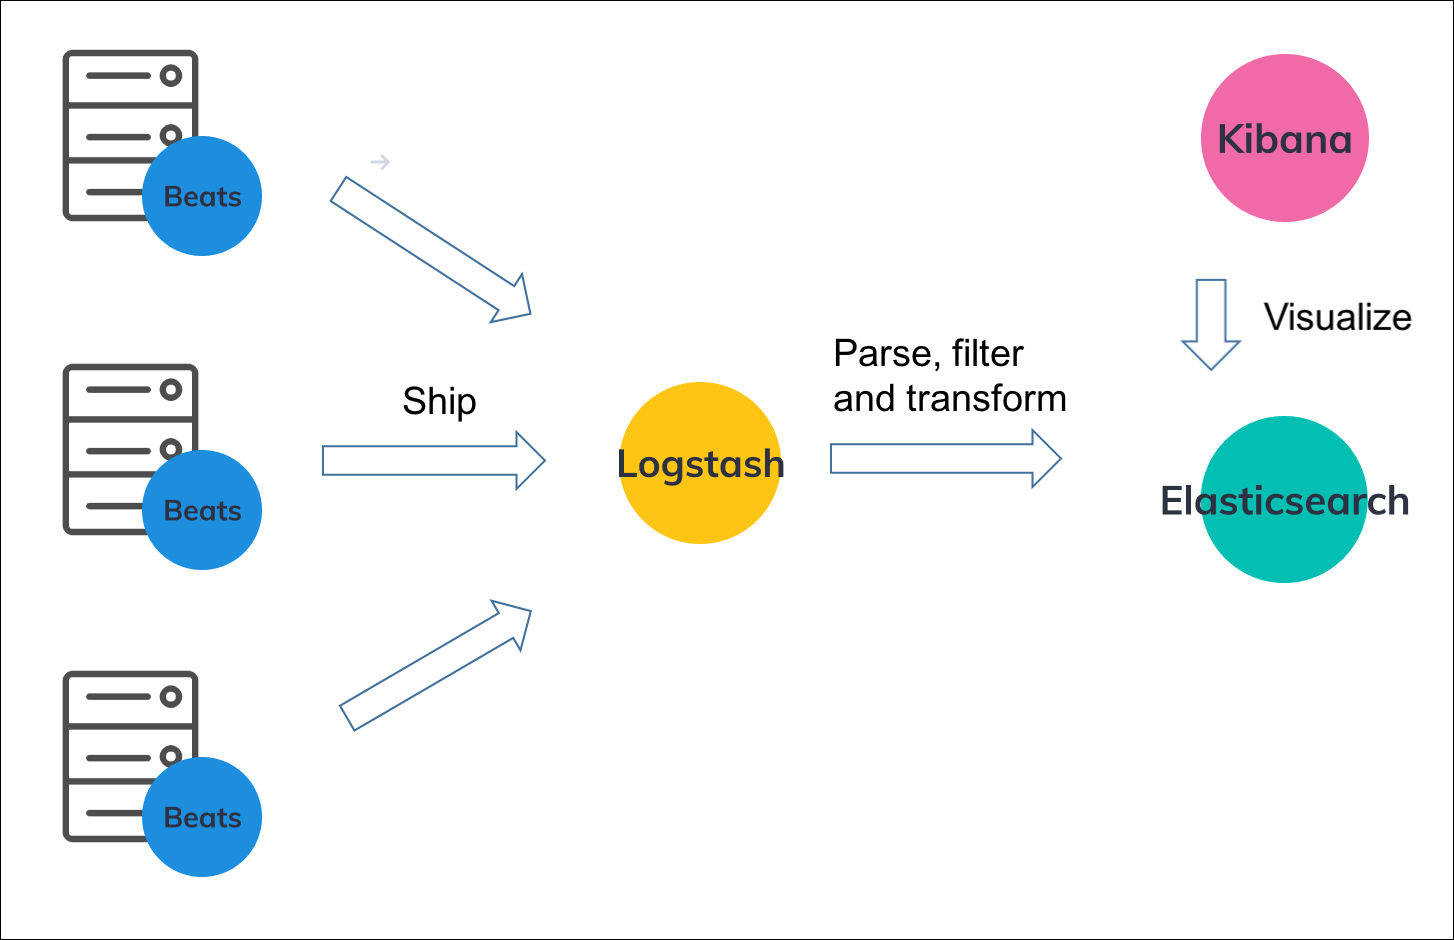
You can see that we are using Filebeat (or any other Beats) on the main server where our application is adding logs to the log file(s). This Filebeat is sending logs to the Logstash server that is being used to process/transform the logs and sends them to Elasticsearch.
Logstash can be on the same or different servers. But I generally prefer it to be on a different server because:
- It is not as lightweight as Filebeat
- We can manage all the pipelines to process logs centrally on a single server.
The biggest advantage of having Filebeat is that, even if the Logstash server is down, it keeps on retrying. I've seen some logs getting lost in the past while using Logstash alone. And of course, Filebeat is quite lightweight.
In other words, I use Filebeat to read the logs from the file (even though Logstash can also do it) and Logstash to add, remove or modify data in the logs.
If it is still unclear or you want to learn more about this, you can read this.
Now let's jump to the implementation.
How to install?
Even if you're using Elastic Cloud, you have to install Filebeat and Logstash on your own. You can use the Logstash pipelines in the Elastic Cloud though. We'll discuss it later in this blog.
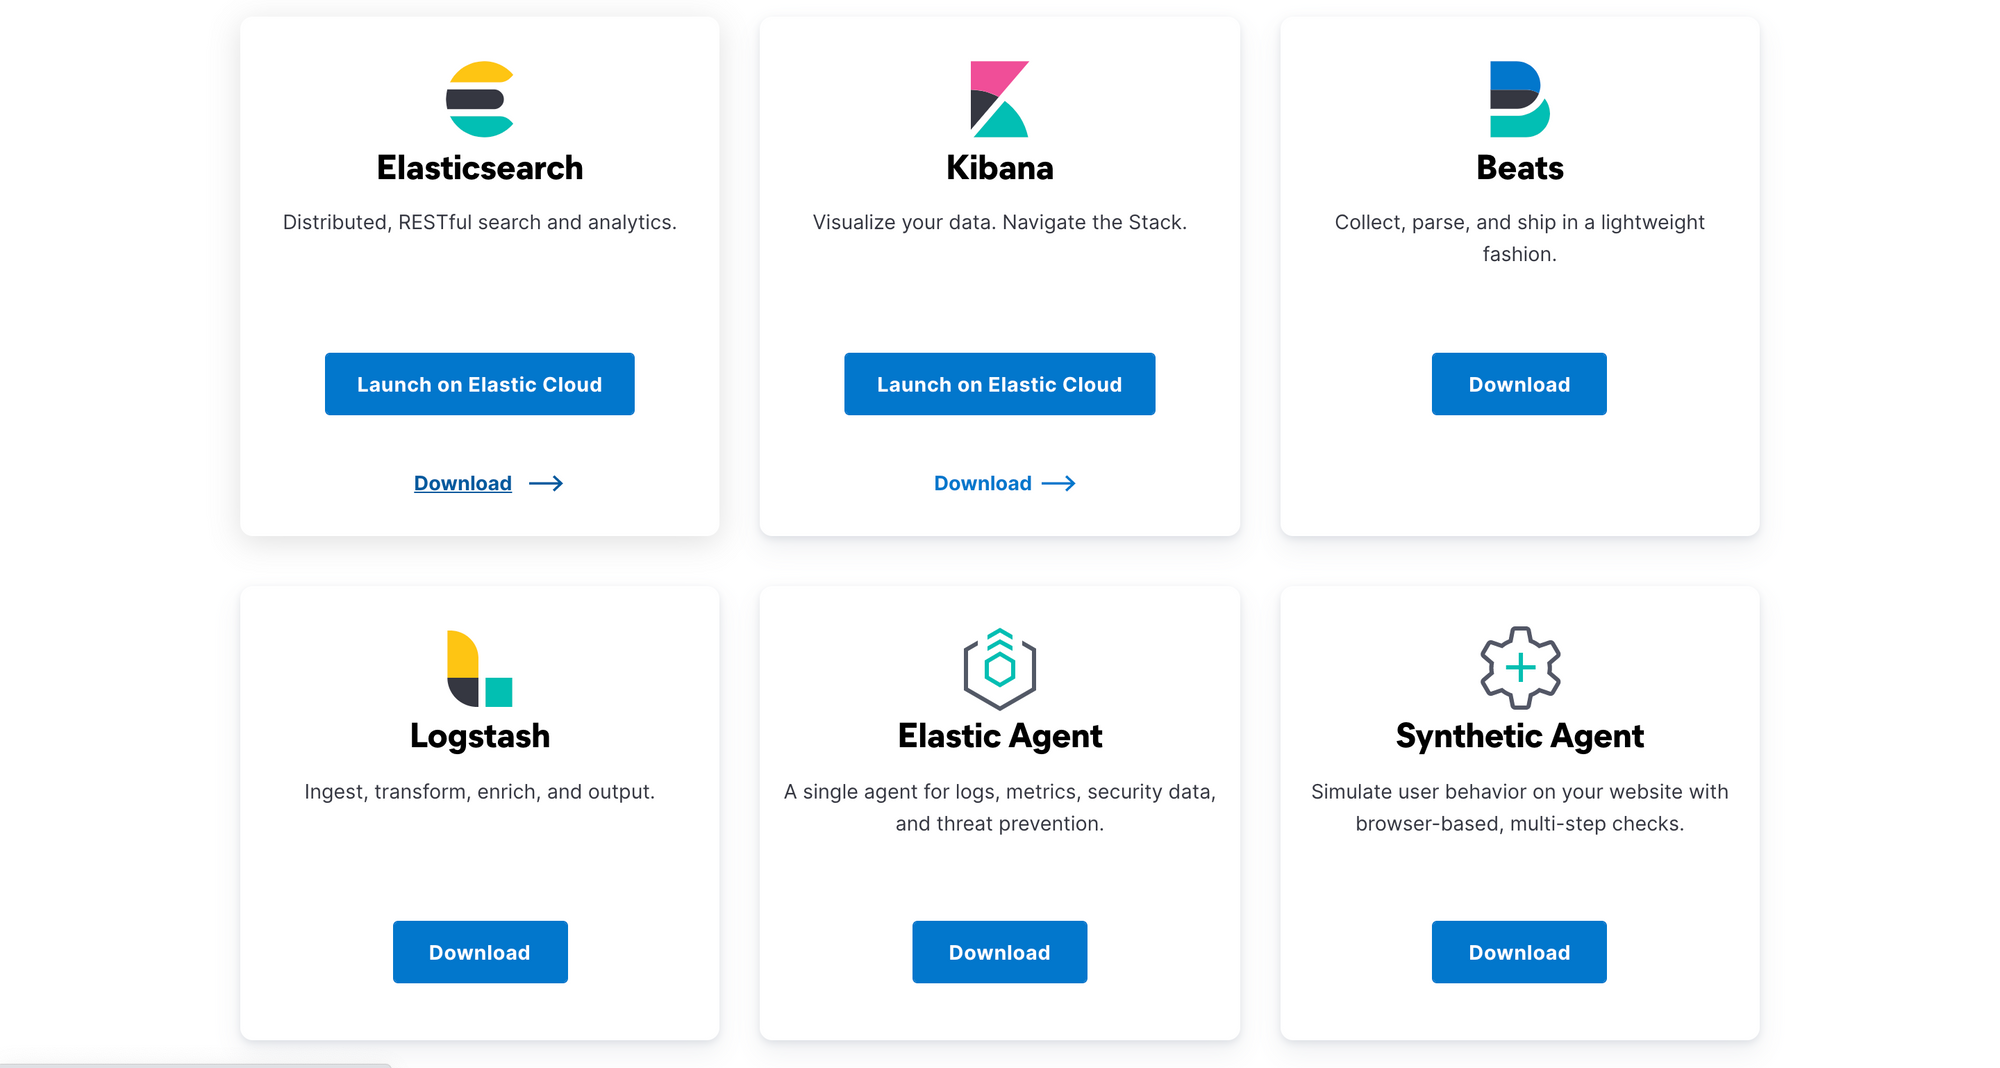
Go to the downloads page and install Elasticsearch, Kibana, Logstash, and Filebeat (Beats section) in the same order. There are instructions to install them using Zip files; Package Managers like apt, homebrew, yum, etc; or Docker. (For Elastic Cloud, you don't have to install Elasticsearch and Kibana).
Setting up self-hosted Elasticsearch
After successfully installing Elasticsearch, run this command to see if it is up:
curl localhost:9200It should print something like this:
{
  "name" : "ip-172-31-33-151",
  "cluster_name" : "elasticsearch",
  "cluster_uuid" : "JPaSI3t1SK-qDXhkSapNmg",
  "version" : {
    "number" : "7.15.0",
    "build_flavor" : "default",
    "build_type" : "deb",
    "build_hash" : "79d65f6e357953a5b3cbcc5e2c7c21073d89aa29",
    "build_date" : "2021-09-16T03:05:29.143308416Z",
    "build_snapshot" : false,
    "lucene_version" : "8.9.0",
    "minimum_wire_compatibility_version" : "6.8.0",
    "minimum_index_compatibility_version" : "6.0.0-beta1"
  },
  "tagline" : "You Know, for Search"
}
Let's understand the basic configurations:
In Ubuntu, the config files are stored in the /etc/elasticsearch directory. You can check where they are located for your respective systems.
The elasticsearch.yml file inside that directory is quite descriptive and by default, you don't need to change anything for a simple setup. But you might need to change these configs for production.
cluster.name: To set a descriptive name of the cluster.node.name: To set a descriptive name of the node in case you're having multiple nodes.path.data: To store the data. You may want to change this to your desired location.path.logs: To store the logs. If you don't want to lose this data, you need to change the location.network.host: By default, it is only accessible vialocalhost. You may need to change this if you've installed this on a different server.
You can also explore jvm.options file if you want to configure the JVM heap size. By default, it is automatically configured by Elasticsearch based on the available memory in your system.
Setting up Kibana
After following the installation steps, if you have installed this on your local machine, you can check test the installation by accessing it on: localhost:5601 from your browser.
If you have installed this using a cloud provider like AWS,
- You need to expose the port
5601using the security groups. - Go to the
/etc/kibanadirectory and openkibana.ymlto edit the configurations. Setserver.host: "0.0.0.0"instead of "localhost". - Finally, go to your browser and access this using
<your_public_ip>:5601and you should be able to see the Welcome page.
Now let's look at the basic configurations of the kibana.yml file
-
server.host: It specifies the address to which the Kibana server will bind. It defaults to "localhost" -
elasticsearch.hosts: The URLs of the Elasticsearch instances to use for all your queries. -
If your Elasticsearch is protected with basic authentication, you need to set these:
elasticsearch.username&elasticsearch.password -
elasticsearch.serviceAccountToken: To authenticate to Elasticsearch via "service account tokens" -
To enable SSL for outgoing requests from the Kibana server to the browser
-
server.ssl.enabled: To enable or disable SSL. Defaults to false. -
server.ssl.certificate: Path to your .crt file -
server.ssl.key: Path to your .key file
-
Setting up Logstash
Once you install and enable Logstash, you can test the configurations by following some of the examples on the official website. If this is your first time or you're struggling with filters, just remove everything inside the filter and try running it.
How to test pipelines?
You can find all the configurations in the /etc/logstash directory (for Ubuntu). If you see the pipelines.yml file, it takes all the files within conf.d folder ending with .conf. You can also set multiple pipelines using multiple ids.
If you just want to test a single file, you can run this command (for Ubuntu):
/usr/share/logstash/bin/logstash -f filename.confLet's create a basic pipeline for Filebeat (For self-hosted)
input {
  beats {
    port => 5044
  }
}

filter {
}

output {
  elasticsearch {
    hosts => ["localhost:9200"]
    index => "applog-%{+YYYY.MM.dd}"
  }
  stdout { codec => rubydebug }
}- This pipeline is will listen on port 5044 for any inputs from beats like Filebeat.
- It will send the logs to the local Elasticsearch instance
- It will send logs to the index starting with
applog-and ending with the date of that particular log. (e.g.applog-2021-10-03) - The
stdoutsection helps us by logging everything on the console.
Pipeline for Elastic Cloud:
input {
  beats {
    port => 5044
  }
}

filter {
}

output {
  elasticsearch {
    cloud_id => "My_deployment:<deployment_id>"
    ssl => true
    ilm_enabled => false
    user => "elastic"
    password => "<password>"
    index => "applog-%{+YYYY.MM.dd}"
  }
  stdout { codec => rubydebug }
}
These configurations should just work fine for your Elastic Cloud.
How about exploring Elastic Cloud's centralized pipelines?
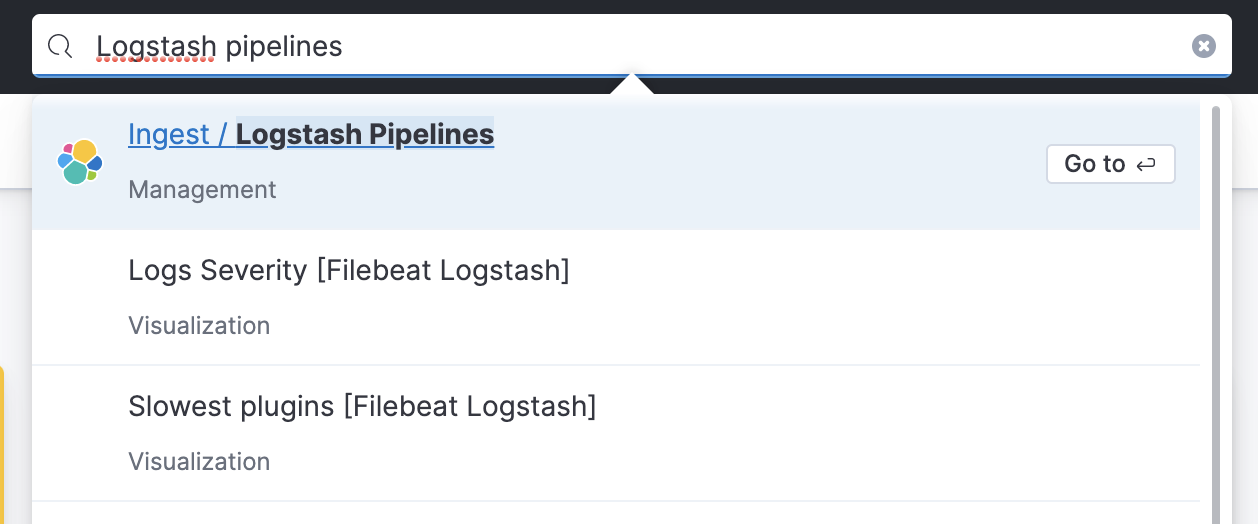
- Search and open
Logstash Pipelinessection in Kibana.
- In this section, click on
Create pipeline.
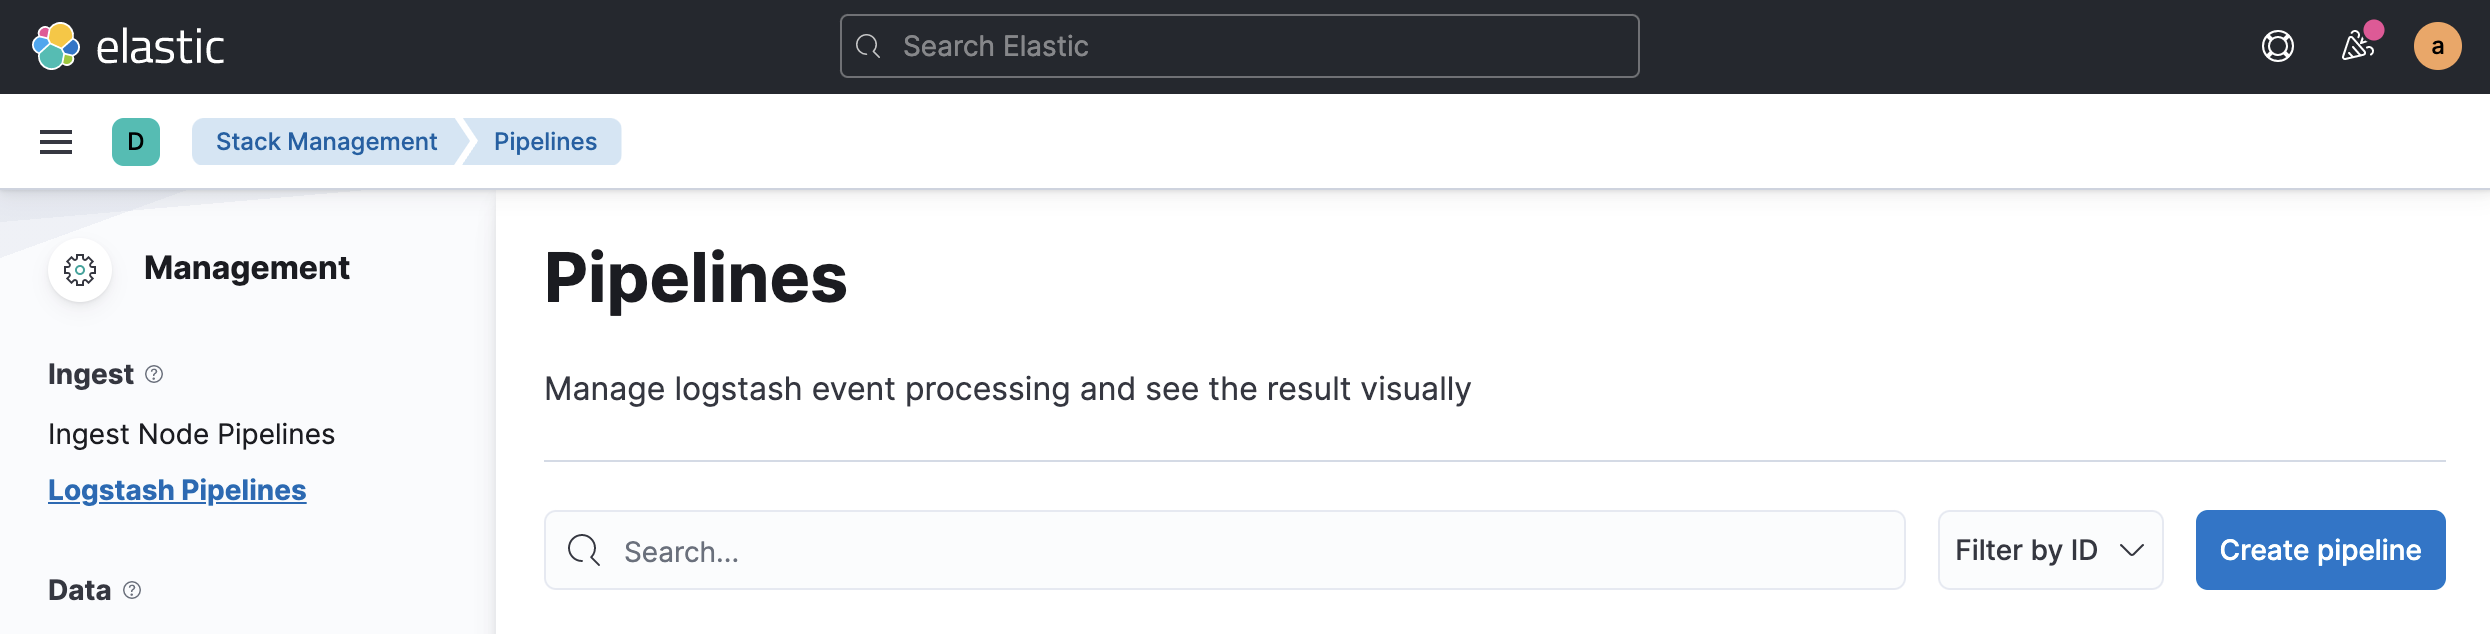
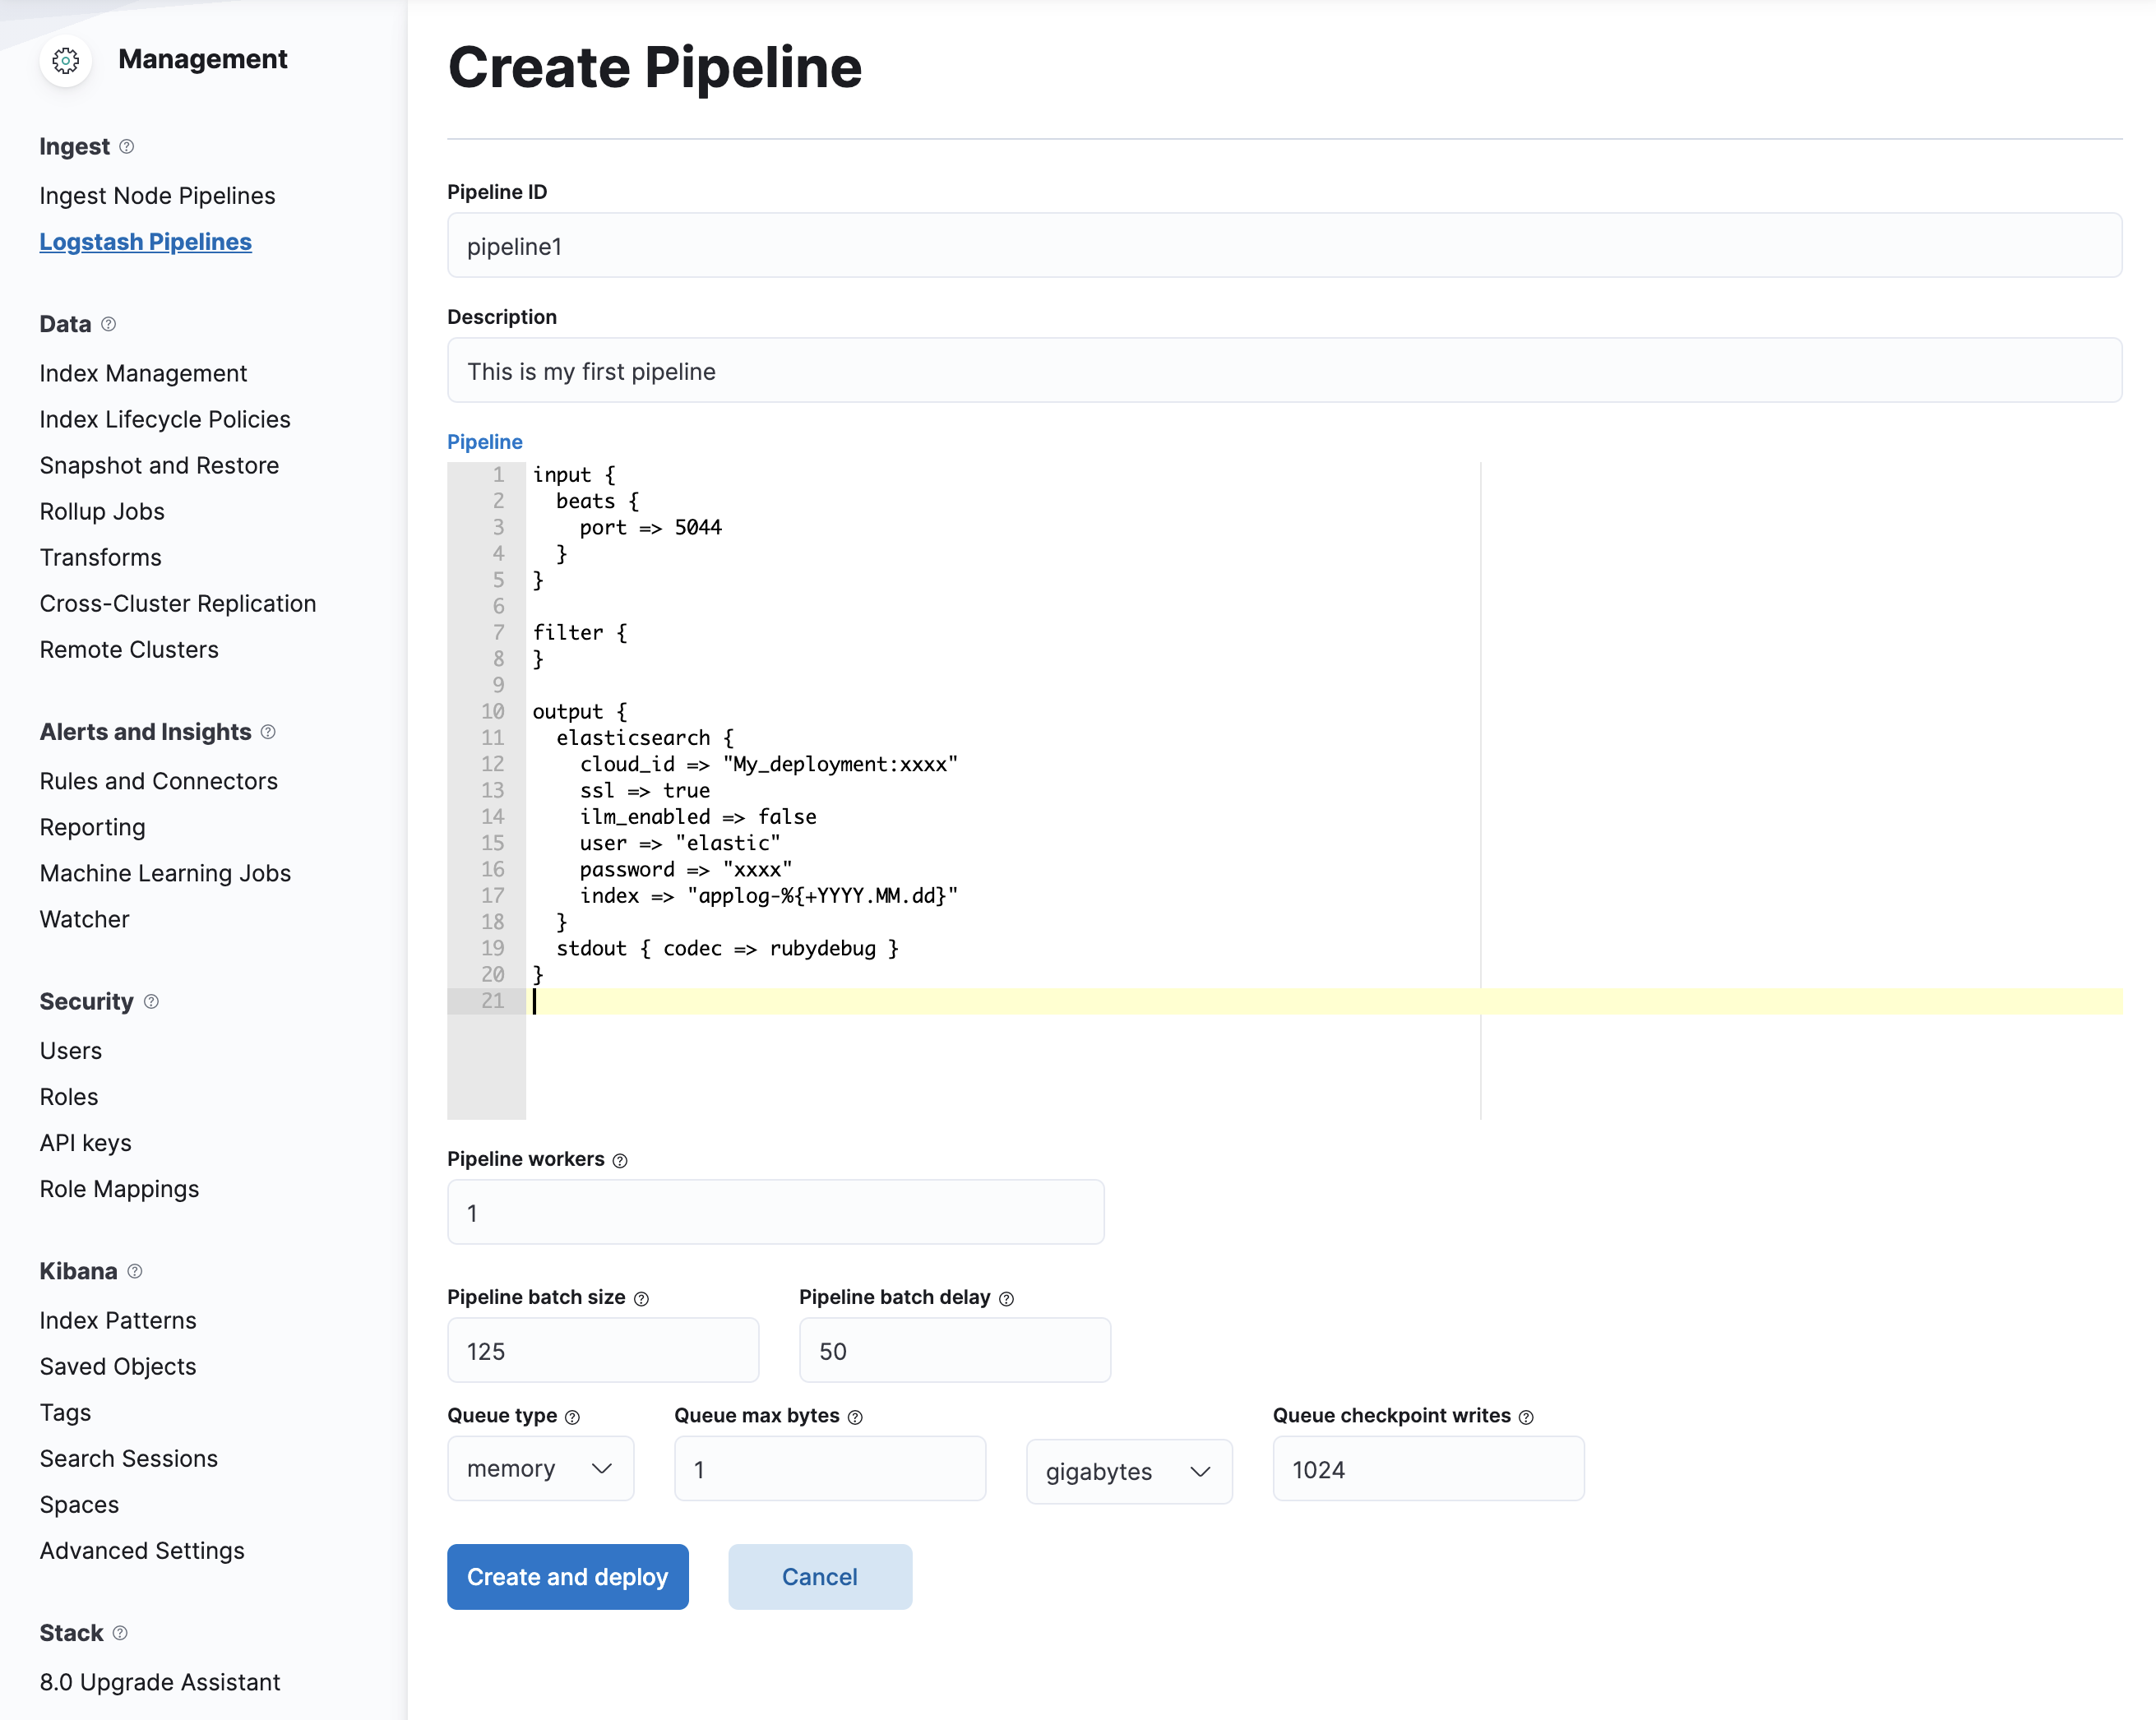
- Inside Create Pipeline section, paste the details above and replace your deployment data. And then click
Create and Deploy. The configurations should look something like this:
Now let's connect our Logstash to these pipelines
Note: We need to have a logstash instance running on our servers. This just replaces the pipelines and not the logstash itself.
- Open your
logstash.ymlfile in/etc/logstashdirectory (Ubuntu). - Search and set these configs:
xpack.management.enabled: true
xpack.management.pipeline.id: ["pipeline1"] # ID of your pipeline
xpack.management.elasticsearch.cloud_id: management_cluster_id:xxxxxxxxxx
xpack.management.elasticsearch.cloud_auth: logstash_admin_user:password
After setting these configs, restart your Logstash service. It will connect to your Cloud instance and start sending logs directly there.
By default, xpack.management.logstash.poll_interval is set to 5s. That means, it checks if there are any changes in your pipeline every 5 seconds.
Setting up Filebeat
Let's quickly jump to Filebeat now.
After the installation, open filebeat.yml file inside /etc/filebeat to modify the configurations.
To send basic logs to Logstash, you can use this:
filebeat.inputs:
- input_type: log
  enabled: true
  paths:
    - /var/log/elk.log

output.logstash:
hosts: ["127.0.0.1:5044"]- Here, it is listening to any change in the
/var/log/elk.logfile. - And it sends the logs to the local Logstash instance which is already listening on port
5044.
But I generally have my application logs in JSON format. You can parse them using Logstash but let's see how you can do this using Filebeat.
filebeat.inputs:
- input_type: log
  enabled: true
  json.keys_under_root: true
  paths:
    - /var/log/elk.log

fileds_under_root: true

output.logstash:
  hosts: ["127.0.0.1:5044"]

processors:
  - decode_json_fields:
      fields: ["something"]
      process_array: true
      overwrite_keys: true
      add_error_key: true
After modifying this file, restart the Filebeat service. If everything is set up correctly, it should work just fine.
You can start testing by appending JSON logs to the /var/log/elk.log file.
echo '{"hello": "world"}' >> /var/log/elk.logLet's say after some time, you may want to add, modify or delete some fields. You can directly do this by Logstash pipeline.
For example, this modification can help you add a new field to your JSON logs. You can search for all the filters for Logstash and use them accordingly.
filter {
  mutate {
    add_field => { "new" => "key" }
  }
}
Let's visualize this on Kibana
Make sure you've pushed the data to Elasticsearch.
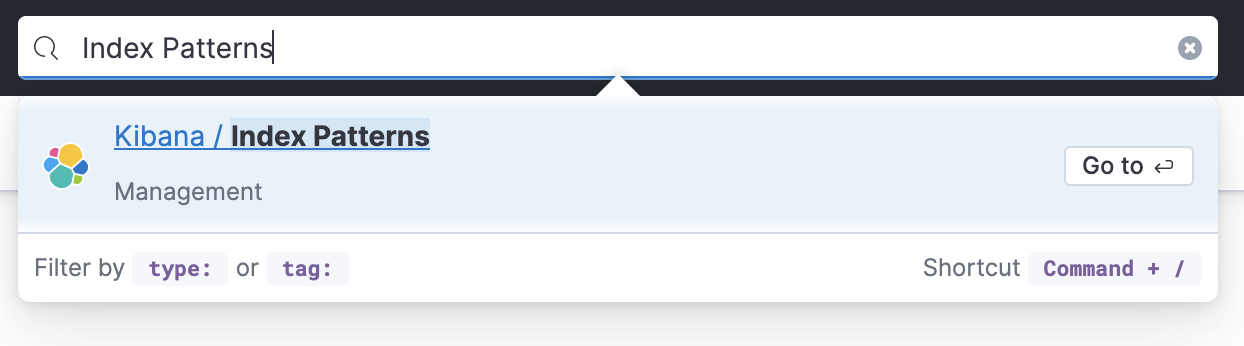
- Search for
Index Patterns.
- Click on
Create index pattern. You'll see something like this:
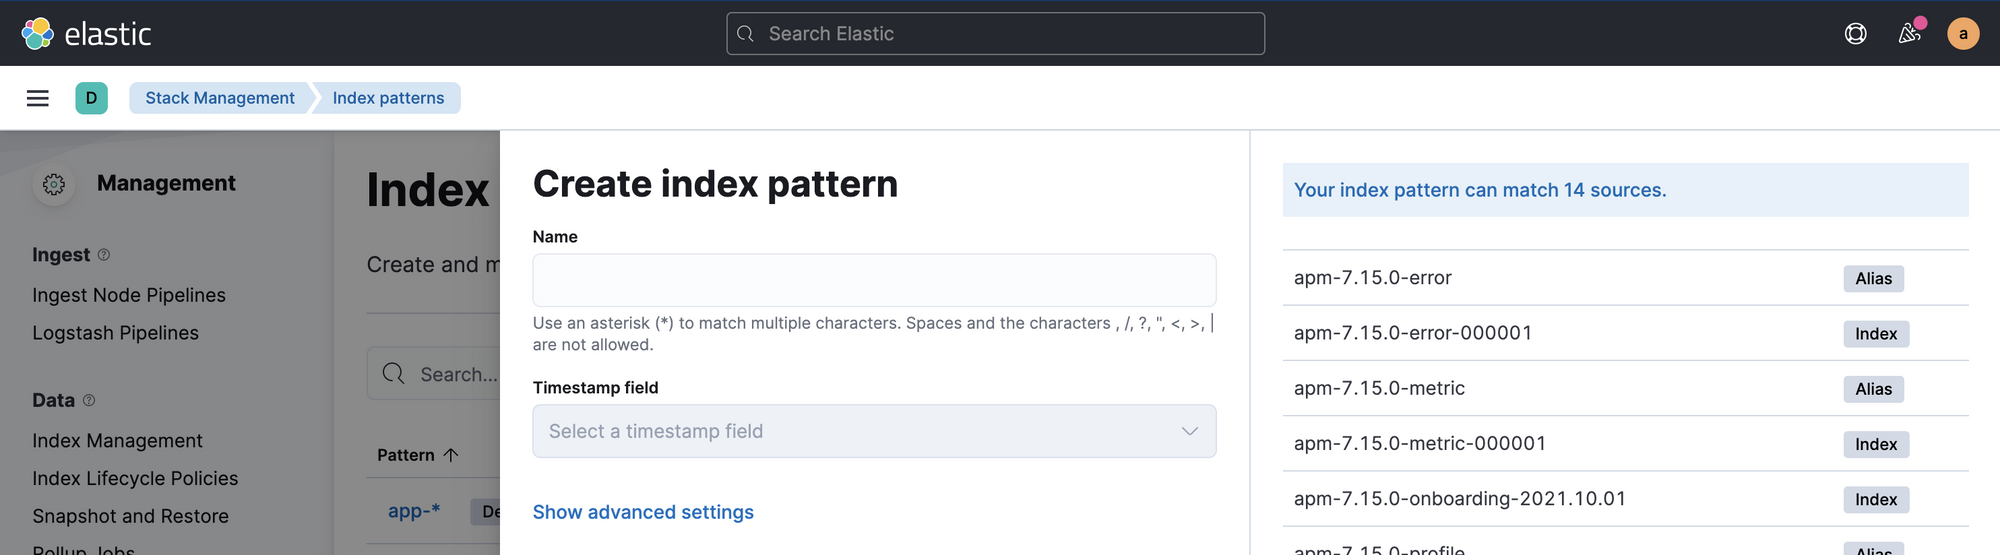
- In
Namefield, enterapplog-*and you'll see the newly created index for your logs. Select@timestampforTimestamp fieldand clickCreate index pattern. - Now go to
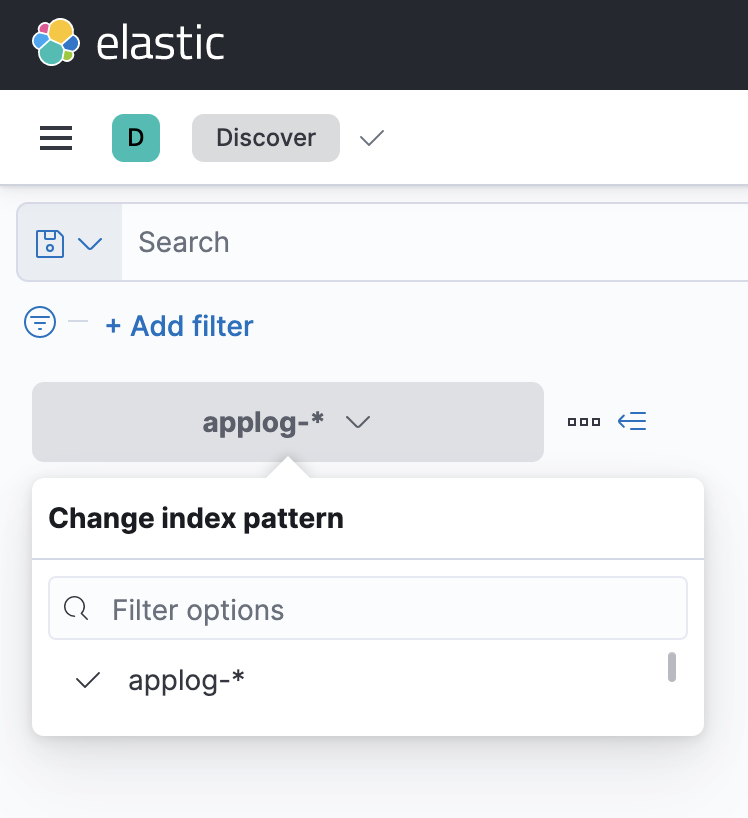
Discoversection (you can also search this if you don't know how to do this) and select your index pattern. You'll be able to see the logs. Also, if you have pushed the logs some time back and they're not showing up, try changing the time range.
Conclusion
So I'm using this configuration for my projects:
Logs inside a file -> Filebeat -> Logstash -> ElasticSearchYou can modify/remove the components as per your requirements. If you like such blogs, please subscribe below. You can also follow me on Twitter.